On baseball diamonds this spring, you will hear coaches consistently praising players for their “good eye” when players hold off on swinging at obvious balls. In Major League Baseball, players have developed reputations for having a good eye or being a hack, which can be supported by statistics like walk rates and strike out rates. While baseball has been at the forefront of utilizing analytics, it has yet to develop a way to measure a player’s ‘good eye’. There is not one statistic that is specifically dedicate to measuring a player’s ability to identify whether a pitch is going to be a strike or ball and make the appropriate decision to swing. With the use of MLB’s Pitchf/X data, I develop this rating for players for the 2015 season.
The first step in this task was to classify each pitch as a strike or a ball. Using the average measured height of each batter from the Pitchf/X data and the plate dimensions, I created a strike zone for each player. Then using the location of where each pitch crossed the plate, I classified the pitch as a strike or a ball. This location data is available for each pitch regardless of whether it was hit or not. I did, however, remove pitches that hit the batter or were for intentional walks leaving me with 697,062 pitches, of which I identified 44.5% of them as strikes.
Now that we know which pitches crossed the plate in the strike zone, I wanted to build a model to that could predict whether or not a pitch would be a strike or ball based on measurements of the pitch right after it is thrown. Player cannot wait until the pitch crosses the plate to decide to swing; they have to make a guess about the end location of the ball fairly soon after the pitcher releases it. So I limited the input variables to the ten 10 features of the ball’s movement measured 50 feet away from the plate, 10 feet after being released by the pitcher. After splitting the data into two sets and training the model with a random forest classifier on the training set, I was able to achieve 90% prediction accuracy on the test set of the data. Then I used the fitted model to predict the probability of strike for every pitch. Below is a histogram showing the breakdown of the probability that a pitch was a strike.
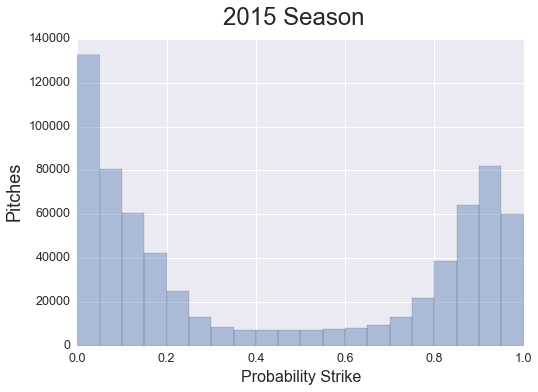
As you can see, most pitches either have a very low probability of being a strike or a high one, with a smaller percentage of them falling into the middle zone.
A machine-learning algorithm was able to accurately predict strikes and balls 90% of the time, but how accurately can a baseball player predict strikes and balls? This is difficult to know since there is no direct data point that tells this. However, we can approximate it by looking at whether or not the hitter swung at the pitch. Logically, if a hitter thinks a ball is going to be a strike he will swing at it, and will not swing if he thinks it is going to be a ball. This is obviously not an exact measure, since the context of the situation might change a hitter’s behavior. A hitter might be ahead in the count, 3 balls and 0 strikes, and hold off on swinging in hopes of drawing a walk. As a general rule though, we would expect a hitter to swing more at pitches that have a high likelihood of being a strike and swing less at pitches that are more likely to be a ball.
In order to check if this logic holds I grouped the pitches into deciles based on their probability of being a strike and then calculated the rate at which players swung at those pitches.
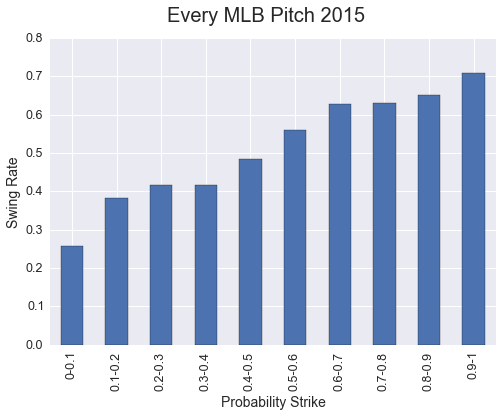 Looking at the league as a whole, players swung at just above 25% of the time at pitches that had a 0-0.1 probability of being a strike, while swinging just over 70% of the time at pitches that had 0.9-1 probability of being a strike. While this trend of swinging more as the probability of strike increases is true for every player in the league, the difference in swing rates can be a lot more drastic for some player than others. 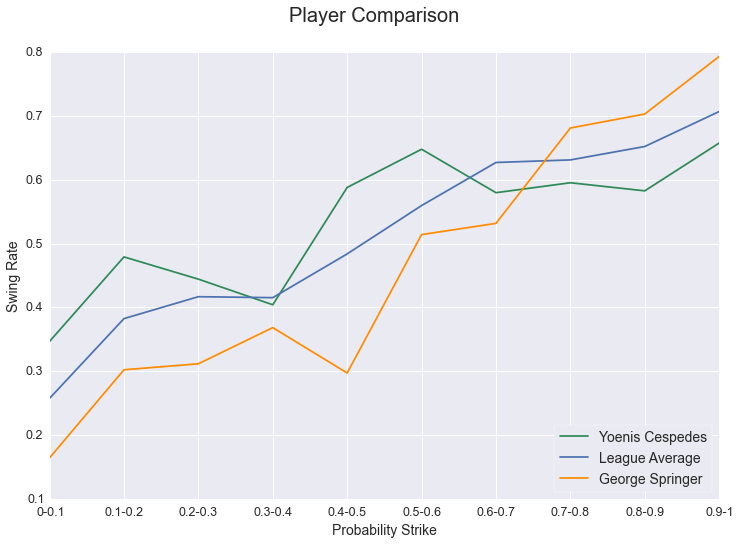 [Click here to compare the swing rates of players for 2015](http://eye-rating.seanabu.com/) As you can see from the graph above, Yoenis Cespedes swings more than the league average at pitches that have a low probability of being a strike, while George Springer swings less at those pitches. This changes however when looking at pitches that have a high probability of being a strike, with Springer swinging more than the league average and Cespedes swinging less. When looking at the graph, it seems that George Springer is much more judicious than Yoenis Cespedes in identifying strikes and balls and deciding to swing at a pitch. How much better is Springer though? These line graphs provide a great visual representation of a player’s swing tendencies, but they are not very useful in comparing multiple players. In order to easily compare all players, we need a rating that condenses a player’s ‘good eye’ and swings into one number. The basis of this rating is whether or not the player made the right decision to swing given the probability of the pitch being a strike. So, a player should swing at every pitch that has a .50 or greater probability of being a strike and should never swing at a pitch that has a .49 or less probability of being a strike. For this initial rating, I set the decision line at .50, but is possible to dynamically alter the decision line based on the context of each pitch. For example, if the count is 3-0 with the bases loaded and 0 outs, we could rule that a player should only swing if a pitch has a probability of being a strike higher than .90. Further analysis would be needed to determine the decision line for each situation. So for each pitch the batter receives a score based on the probability that the pitch would be a strike, and their decision to swing. For every pitch where the batter makes the correct decision he receives a score of 0, but for every pitch where he makes the wrong decision, he receives a score relative to how bad of a decision he made. For example, if a player swings at a pitch that had a .05 probability of being a strike his pitch score is much higher than a player that swings at a pitch with a 0.45 probability of being a strike. The closer the probability of the pitch being a strike is to the decision line, the less a player should be punished for making a wrong decision. The exact calculation of the pitch score when a player makes the wrong decisions is: Pitch Score = abs(Probability Strike – Decision Line)*100 After a score is calculated for each pitch, the mean of those scores is calculated for each player to determine his “Eye Rating.” Under this formula, a player who perfectly makes decisions about swinging would have a rating of zero, and as the rating increases it means the player is worse at making the correct decision. 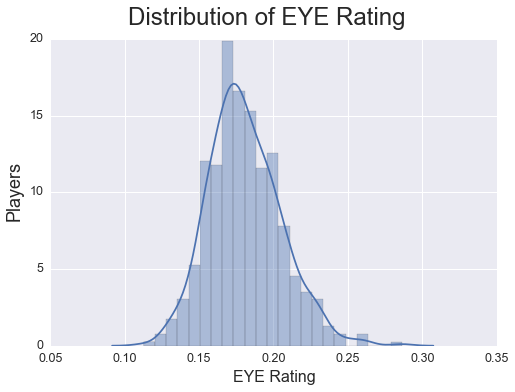 For the 528 players that saw at least 200 pitches during the 2015 season, the mean EYE Rating is 11.53 with a standard deviation of 1.38. Mike Baxter had the lowest/best rating at 7.59, and Rubby De La Rosa had the highest/worst rating at 17.9. For hitters who had faced over 1000 pitches, Yoenis Cespedes had the worst rating at 14.41, while George Springer had the best rating at 8.56 **Top 10 players by EYE Rating** | | Name | PA | EYE Rating | BA | OBP | SLG | SO Rate | BB Rate | |----|------------------|-----|------------|-------|-------|-------|---------|---------| | 1 | George Springer | 451 | 8.56 | 0.276 | 0.367 | 0.459 | 0.242 | 0.111 | | 2 | Ruben Tejada | 407 | 8.68 | 0.261 | 0.338 | 0.350 | 0.172 | 0.093 | | 3 | Brandon Belt | 556 | 8.71 | 0.280 | 0.356 | 0.478 | 0.264 | 0.101 | | 4 | Chris Carter | 460 | 8.75 | 0.199 | 0.307 | 0.427 | 0.328 | 0.124 | | 5 | Chris Iannetta | 317 | 8.76 | 0.188 | 0.293 | 0.335 | 0.262 | 0.129 | | 6 | Dexter Fowler | 690 | 8.87 | 0.250 | 0.346 | 0.411 | 0.223 | 0.122 | | 7 | Nick Hundley | 389 | 9.30 | 0.301 | 0.339 | 0.467 | 0.195 | 0.054 | | 8 | Andrew McCutchen | 685 | 9.33 | 0.292 | 0.401 | 0.488 | 0.194 | 0.143 | | 9 | David Ortiz | 614 | 9.41 | 0.273 | 0.360 | 0.553 | 0.155 | 0.125 | | 10 | Gregor Blanco | 372 | 9.52 | 0.291 | 0.368 | 0.413 | 0.159 | 0.108 | **Bottom 10 players by EYE Rating** | | Name | PA | EYE Rating | BA | OBP | SLG | SO Rate | BB Rate | |------|-----------------|-----|------------|-------|-------|-------|---------|---------| | 1 | Yoenis Cespedes | 676 | 14.41 | 0.291 | 0.328 | 0.542 | 0.209 | 0.049 | | 2 | Salvador Perez | 553 | 14.31 | 0.260 | 0.280 | 0.426 | 0.148 | 0.024 | | 3 | Jeff Francoeur | 343 | 14.26 | 0.258 | 0.286 | 0.433 | 0.225 | 0.038 | | 4 | Kevin Pillar | 628 | 14.13 | 0.278 | 0.314 | 0.399 | 0.135 | 0.045 | | 5 | Pablo Sandoval | 505 | 13.99 | 0.245 | 0.292 | 0.366 | 0.145 | 0.050 | | 6 | J.J. Hardy | 437 | 13.95 | 0.219 | 0.253 | 0.311 | 0.201 | 0.046 | | 7 | C.J. Cron | 404 | 13.95 | 0.262 | 0.300 | 0.439 | 0.203 | 0.042 | | 8 | Freddy Galvis | 603 | 13.81 | 0.263 | 0.302 | 0.343 | 0.171 | 0.050 | | 9 | Adam Lind | 572 | 13.67 | 0.277 | 0.360 | 0.460 | 0.175 | 0.115 | | 10 | Jose Iglesias | 454 | 13.62 | 0.300 | 0.347 | 0.370 | 0.097 | 0.055 | [Click for the EYE Ratings of all Players](http://eye-rating.seanabu.com/stats) Now we have a rating where we can compare players and see who has the best “eye” and who has the worst, but does this rating mean anything? Does having a lower Eye rating actually lead to more hits and walks? To determine this I calculated the correlation coefficient between the EYE Rating and other batting statistics like batting average, on-base percentage, and walk rate. Below is a heat map showing those correlations. 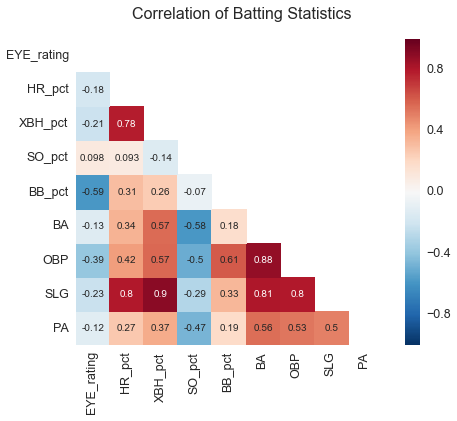 The strongest correlation with the EYE rating is a player’s walk rate. As expected, the lower (better) the EYE rating, the more often the batter walks. There is also a moderate negative correlation with on-base percentage. This probably is being driven by the strong correlation between on-base percentage and walk rate considering the small correlation the EYE rating has with batting average. There was a surprisingly small correlation between the Eye rating and strike out rate. One would think that if a hitter is more likely to swing at pitches that are strikes they would be less likely to strike out, but the data does not support that. What is promising is that the rating is not strongly correlated to their number of plate appearances. This is important because a player’s rating is not a result of how many at bats they have. So how can this rating be helpful to teams, coaches, and players? It can be used to direct coaches and players on what skills they should improve. Yoenis Cespedes batted close to 0.300 last year despite his abysmal eye rating. By giving him [training on how to recognize pitches](http://baseballnews.com/pitch-recognition-can-be-done-by-hitters/), Yonis could theoretically greatly improve his walk rate and on-base percentage. Also, coaches could understand which players are more likely to swing at bad pitches and change their strategy when pitching to those players, throwing them more balls in hopes that they will chase them. Finally, it could be used to help project the future career of a player. As a player spends more time in the major leagues, they should get better at identifying pitches and reacting appropriately. By looking at the historical trajectory of players’ EYE rating, we can tell if a player is making those improvements and properly adjusting to the competition. There are various ways this rating could be improved, such as changing the decision line based on the context of the pitch. Another variable to take into account could be the tendendcies of the umpire. In developing the model that predicts the probability of a pitch being a strike, I use a set strike zone. In real life though, the strike zone can change based on the umpire. So a decision to swing at a pitch that is high in the strike zone might look bad according to my model, but could be correct if the umpire has a known tendency to call those pitches strikes. Combining umpire tendencies with adjusting the decision line for each pitch could provide a better measure of whether players are making the appropriate decision. Also more analysis should be done to study this rating over multiple years, it is a good start to measuring players’ decisions to swing.