Listening to sports talk radio or talking to your coworker on Slack, it might seem as if this year’s tournament was the craziest ever. There was the first ever #16 seed to upset a #1 seed. Loyola-Chicago became the fourth #11 seed to make it to the Final Four, and Kansas State and Florida State both made it to Elite Eight as #9 seeds. With all of that madness on one side of the bracket, the other side has been much tamer with two #1 seeds making it to the Final Four. So how much Madness was there this March? How does it compare to 2011 when 8th-seeded Butler made it to the championship game and VCU made it to the Final Four as a #11 seed? Was it crazier than 1985 when Villanova won the championship as a #8 seed?
The short answer is I have 2018 ranked third behind, behind 2014 and 2013.
Upset Score by Year
When looking to answer this question, I was unable to find any measure that fully judges the “Madness” of each tournament. Some articles compare the average seeding of the Final Four participants, but this is an incomplete answer because it doesn’t take into account all of the chaos that can happen throughout the tournament. There are years like 1995 which had a lot of first round upsets, but by the later rounds, the higher seeded teams restored order and the eventual champion was #1-seeded UCLA. Other years are like 2000 where the first round produced fewer upsets, but you ended up with two #8 seeds in the Final Four with Wisconsin and North Carolina. To address this, I created an “upset score” that takes into account all aspects of the “Madness”: large individual game upsets (UVA & UMBC), Cinderella runs (Loyola Chicago), and the overall number of upsets in the tournament.
I create this measure by quantifying the difference between the final bracket results and the expected bracket at the beginning of the tournament. I define the “expected bracket” as one that goes “chalk” – where the higher seed wins every game – ending with only #1 seeds in the Final Four.
The upset score for a tournament is calculated per game basis and then added up over the entire tournament. For each game a score is assessed by subtracting the seed of the actual winner of that game from that of the expected winner. So when a #1 seed beats a #16 seed, that game earns 0 points because the #1 seed was the expected winner. However, when #16-seeded UMBC’s Golden Retrievers beat #1 seed UVA, that game earned a score of 15. In the second round, when #9-seeded Kansas St. beat UMBC, that game earned a score of 8. This is the difference in seeding between Kansas St. and the expected winner, #1-seeded UVA. Yes, Kansas State was the favorite heading into their matchup against UMBC, but that was not the expected matchup. At the beginning of the tournament #1 UVA, not Kansas State, was expected to be in the Sweet Sixteen.
This scoring format takes into consideration the likelihood of each upset, according to seeding, as well as deep runs by Cinderella teams. A tournament that goes ‘chalk’ would earn an upset score of 0. While the opposite, a tournament where the lower seed wins every game, would have a score of 655. The average upset score of the tournaments over the last 34 years has been 96 points.
| Season | Champion | RunnerUp | 1 | 2 | 3 | 4 | 5 | 6 | Total | Cinderella | Unexpected Winners |
|---|---|---|---|---|---|---|---|---|---|---|---|
| 1985 | Villanova | Georgetown | 33 | 38 | 8 | 8 | 7 | 7 | 101 | Villanova | 20 |
| 1986 | Louisville | Duke | 38 | 49 | 25 | 11 | 1 | 1 | 125 | LSU | 23 |
| 1987 | Indiana | Syracuse | 45 | 28 | 12 | 6 | 1 | 0 | 92 | LSU | 22 |
| 1988 | Kansas | Oklahoma | 29 | 30 | 11 | 6 | 5 | 5 | 86 | Kansas | 19 |
| 1989 | Michigan | Seton Hall | 54 | 10 | 9 | 5 | 4 | 2 | 84 | Minnesota | 25 |
| 1990 | UNLV | Duke | 35 | 48 | 28 | 8 | 2 | 0 | 121 | Loy Marymount | 26 |
| 1991 | Duke | Kansas | 57 | 24 | 13 | 3 | 3 | 1 | 101 | Temple | 21 |
| 1992 | Duke | Michigan | 36 | 27 | 11 | 9 | 5 | 0 | 88 | Michigan | 20 |
| 1993 | North Carolina | Michigan | 36 | 25 | 6 | 1 | 0 | 0 | 68 | G Washington | 15 |
| 1994 | Arkansas | Duke | 29 | 28 | 10 | 4 | 1 | 0 | 72 | Boston College | 21 |
| 1995 | UCLA | Arkansas | 48 | 11 | 6 | 5 | 1 | 0 | 71 | Old Dominion | 19 |
| 1996 | Kentucky | Syracuse | 37 | 19 | 7 | 7 | 3 | 0 | 73 | Arkansas | 18 |
| 1997 | Arizona | Kentucky | 39 | 37 | 15 | 3 | 3 | 3 | 100 | Chattanooga | 20 |
| 1998 | Kentucky | Utah | 47 | 36 | 9 | 5 | 3 | 1 | 101 | Valparaiso | 24 |
| 1999 | Connecticut | Duke | 50 | 48 | 17 | 3 | 0 | 0 | 118 | Gonzaga | 26 |
| 2000 | Michigan St | Florida | 11 | 45 | 28 | 18 | 4 | 0 | 106 | North Carolina | 22 |
| 2001 | Duke | Arizona | 65 | 33 | 14 | 3 | 1 | 0 | 116 | Temple | 25 |
| 2002 | Maryland | Indiana | 43 | 35 | 23 | 5 | 4 | 0 | 110 | Missouri | 19 |
| 2003 | Syracuse | Kansas | 30 | 27 | 7 | 5 | 3 | 2 | 74 | Butler | 24 |
| 2004 | Connecticut | Georgia Tech | 18 | 33 | 16 | 4 | 3 | 1 | 75 | Alabama | 21 |
| 2005 | North Carolina | Illinois | 38 | 32 | 17 | 7 | 0 | 0 | 94 | WI Milwaukee | 23 |
| 2006 | Florida | UCLA | 51 | 31 | 13 | 16 | 3 | 2 | 116 | George Mason | 25 |
| 2007 | Florida | Ohio St | 13 | 11 | 1 | 2 | 0 | 0 | 27 | UNLV | 13 |
| 2008 | Kansas | Memphis | 42 | 30 | 10 | 0 | 0 | 0 | 82 | Davidson | 16 |
| 2009 | North Carolina | Michigan St | 46 | 9 | 2 | 3 | 1 | 0 | 61 | Arizona | 17 |
| 2010 | Duke | Butler | 48 | 40 | 13 | 9 | 4 | 0 | 114 | Cornell | 26 |
| 2011 | Connecticut | Butler | 35 | 40 | 24 | 22 | 9 | 2 | 132 | VA Commonwealth | 25 |
| 2012 | Kentucky | Kansas | 66 | 33 | 9 | 5 | 1 | 0 | 114 | Ohio | 22 |
| 2013 | Louisville | Michigan | 64 | 41 | 16 | 14 | 3 | 0 | 138 | FL Gulf Coast | 24 |
| 2014 | Connecticut | Kentucky | 46 | 39 | 24 | 14 | 13 | 6 | 142 | Connecticut | 24 |
| 2015 | Duke | Wisconsin | 35 | 30 | 9 | 6 | 0 | 0 | 80 | Michigan St | 16 |
| 2016 | Villanova | North Carolina | 71 | 26 | 12 | 11 | 1 | 1 | 122 | Syracuse | 26 |
| 2017 | North Carolina | Gonzaga | 26 | 25 | 18 | 8 | 0 | 0 | 77 | Xavier | 16 |
| 2018 | Villanova | Michigan | 49 | 45 | 27 | 12 | 2 | 0 | 135 | Loyola-Chicago | 26 |
In 2014, the tournament started off normal with a first round score of 46 points, about 5 more than the average. But as the 8th-seeded Kentucky Wildcats and the 7th-seeded UConn Huskies marched towards the finals – the largest average seed of any championship game – that year’s score rose to the top. The second “maddest” tournament, in 2013, unfolded in a completely different manner. The underdogs that year racked up 105 points through the first two rounds – the most ever – but the #1 seeded Louisville Cardinals won the championship that year, preventing it from being the craziest ever.
The least chaotic tournament ever was 2007 when #1 Florida beat fellow #1 seed Ohio State, and the total upset score was 27. There were only 13 games in which a the winning seed was not the expected winner, and eight of these “upsets” were by teams ranked only one seed lower than their opponent. The biggest Cinderella that year was #7-seed UNLV, who made only it to the Sweet Sixteen. 30 other tournaments had a higher upset score in just the first round than 2007 had for the entire tournament. The next least chaotic year was 1995, which had a upset score that was 2.5 times higher than 2007.
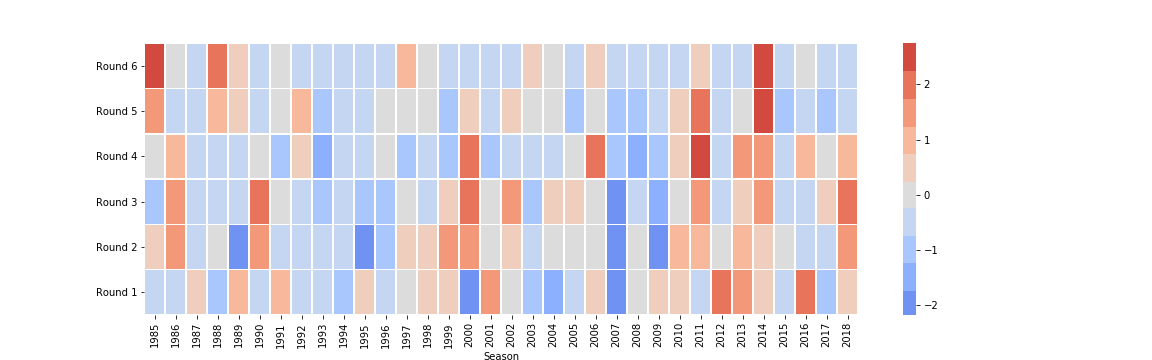
Looking at the heatmap below you can see how tournaments developed through the rounds. The darker red square show rounds where there was a higher upset score compared to the same round for all other years. Conversely, the darker blue squares highlight rounds where the upset score is lower compared to the same round for all other years.
Who has been the biggest Cinderella of all time? That title remains with the 1985 Villanova Wildcats. As the lowest seed (#8) to ever win a championship, their tournament run earned a score of 35, which beats out the four #11 seeds (1985 LSU, 2006 George Mason, 2011 VCU, and 2018 Loyola-Chicago) who scored 32 by making it to the Final Four.
Biggest Cinderella Teams
| Season | Cinderella | Upset Score |
|---|---|---|
| 1985 | Villanova | 35 |
| 1986 | LSU | 32 |
| 2011 | VA Commonwealth | 32 |
| 2006 | George Mason | 32 |
| 2018 | Loyola-Chicago | 32 |
| 2016 | Syracuse | 28 |
| 2014 | Connecticut | 28 |
| 2002 | Missouri | 26 |
| 2013 | FL Gulf Coast | 26 |
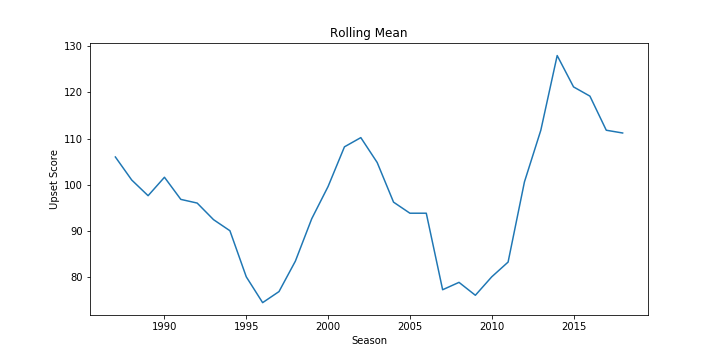
It is easy to look at the upset scores over the past decade and believe there is an upward trend. Some might use these recent scores as evidence that there is more parity in college basketball or argue that the committee is incorrectly seeding the teams to create more madness. Looking at the trendline of the scores ever since the tournament expanded to 64 teams, we see this could be more of a cyclical ebb and flow and not overall change in the college basketball landscape. While this score has no predictive power for future tournaments, it does help give some context around all previous tournaments. So when your co-worker makes some hyperbolic statement about this being the crazy tournament ever, you can tell them, “Well actually…”
Future Explorations:
Some might argue that a ‘chalk’ bracket is not the ‘expected’ bracket and every year there are teams that the public and Vegas pick to outperform their seeding. (How did your pick for Arizona in the Final Four work out this year?) It is possible I could include Vegas odds for each team winning the Championship as a way of defining or weighing an upset. This would require a monumental effort to find and aggregate all of that data. Another option would be to use some sort of rating like RPI, to help determine the “expected bracket” and to weight each upset.
Initially, I looked at using the results of ESPN’s Tournament Challenge as a way of evaluating each year. For every year I could take the score of the millions of brackets submitted and calculate the average score for that year and then be able to compare the madness of each year by looking at this score. For example, if one year the average score of all the brackets was 700 points and the next year it was 800 points, we could assume the latter tournament was more predictable because participants were better able to predict the results. An added benefit of this measure is that it would take into consideration how likely the public though certain teams were to be upset. For example, in a year when people think a particular #1 seed is weak and a lot of brackets correctly foreshadow their upset, the average score of all the brackets would be higher than a year when a completely unexpected #1 seed is upset. This method, however, would limit the years of historical comparison to the last 21 years that ESPN has hosted the tournament. Also, as the popularity of the contest and the cash prizes given for winning it increase, more people are filling out brackets and possibly changing their selection strategy in order to create a more unique bracket. These changes in the data sample make it difficult to compare across the years.